Diversity, Equity, and Inclusion
Stats and Plans
Center for Data Science Diversity, Equity, and Inclusion Initiatives & Efforts
2022-2023 CDS Efforts Highlights
Funded
student attendance for 2022 Grace Hopper Conference
Sponsored
2022 Women in Statistics and Data Science Conference
Sponsored
the 2022 Society of Hispanic Professional Engineers (SHPE) Conference
Continued
the CURP program for Summer 2023
Started
AI, Misinformation, and Policy Seminar Series
Co-Sponsored
NYU Race and Racism in the Sciences Series (collaboration with Psychology, Neural Science, Biology, and Chemistry)
View Additional CDS Efforts
Academic Year 2021-2022
- Started Diversity Affinity student group
- Sponsored Grace Hopper Conference
- Participated in Out in STEM conference
- Continued the CURP program for Spring 2022 and Summer 2022
Academic Year 2020-2021
- Supported students, researchers, and faculty to participate in the 2020 Grace Hopper Annual Conference.
- Participated in the National Association of African American Honors Programs (NAAHP) Graduate Program recruiting event.
Academic Year 2019-2020
- Participated in Great Minds in STEM to connect with Latinx students who are studying STEM.
- Attended the SACNAS National Diversity in STEM Conference to promote CDS’s graduate programs to underrepresented STEM students.
- Participated in New York University Graduate and Professional School Fair.
Academic Year 2018-2019
- Attended the Idealist Graduate School Fair in Washington DC, and the National Diversity College Fair in Boston to reach diverse prospective graduate students.
- Took part in Beckman Scholar STEM Symposium and STEM Opportunities Fair at Barnard College.
In addition to these admissions efforts, the Center for Data Science:
- Created a Diversity, Equity, and Inclusion Committee that meets on a regular basis.
- Leveraged the Diversity Initiative supported by the Partners Program to provide financial support to approx. 25 underrepresented graduate students.
- Gave a talk, presented by Faculty, Prof. Andrea Jones-Rooy, to NYU College and Career labs, which is designed to serve economically disadvantaged, first-generation college-going, and historically underrepresented students from New York City schools.
- Launched CDS Women in Data Science student group.
- Hosted events with Women in Data Science NYC meet-ups.
- Collaborated with NYU Courant GSTEM to help provide mentoring resources to female high school students who are interested in STEM.
- Supported the student-led community-building group, Leadership Circle.
- Launched the CDS Undergraduate Research Program (CURP) to provide faculty mentorship to a diverse group of undergraduate students.
- Developed and launched Data Science Student Affinity Group.
Where We Are Now…
Below you’ll find enrollment statistics on race, gender, country of origin, and first generation status.
52.2%
Over 50% of our MS student population was female in fall 2022
85.8%
Increase in our Black PhD student enrollment in fall 2022
29.4%
Maintains a PhD female student population that is higher than the average in STEM graduate programs
Race
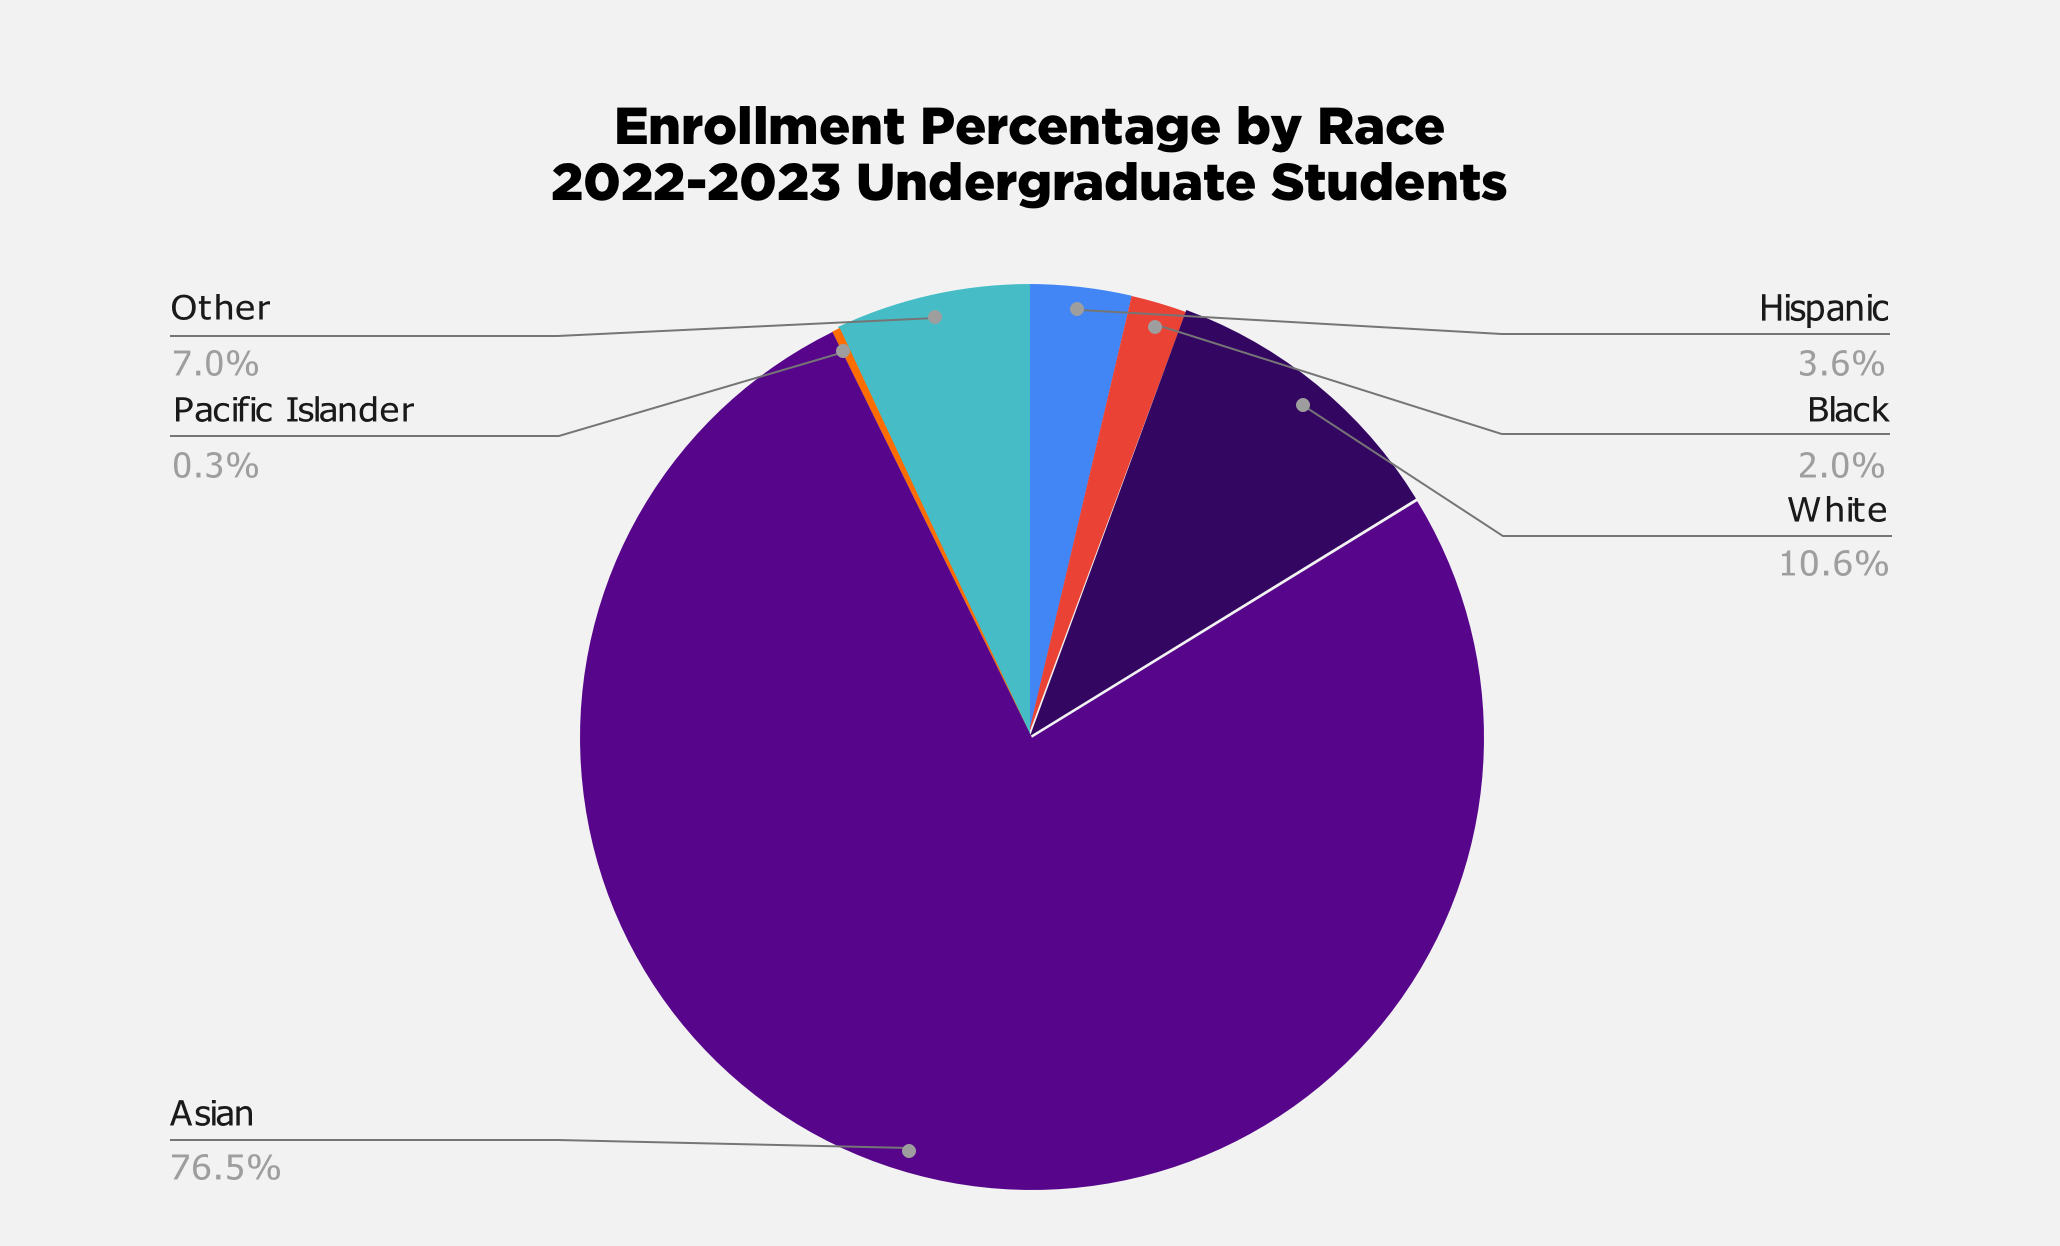
View Undergraduate Enrollment Numbers by Race ↓
*2022-2023
- Hispanic: 3.73%
- Black: 2.02%
- White: 10.89%
- Asian: 78.38%
- Pacific Islander: 0.31%
- Other: 7.15%
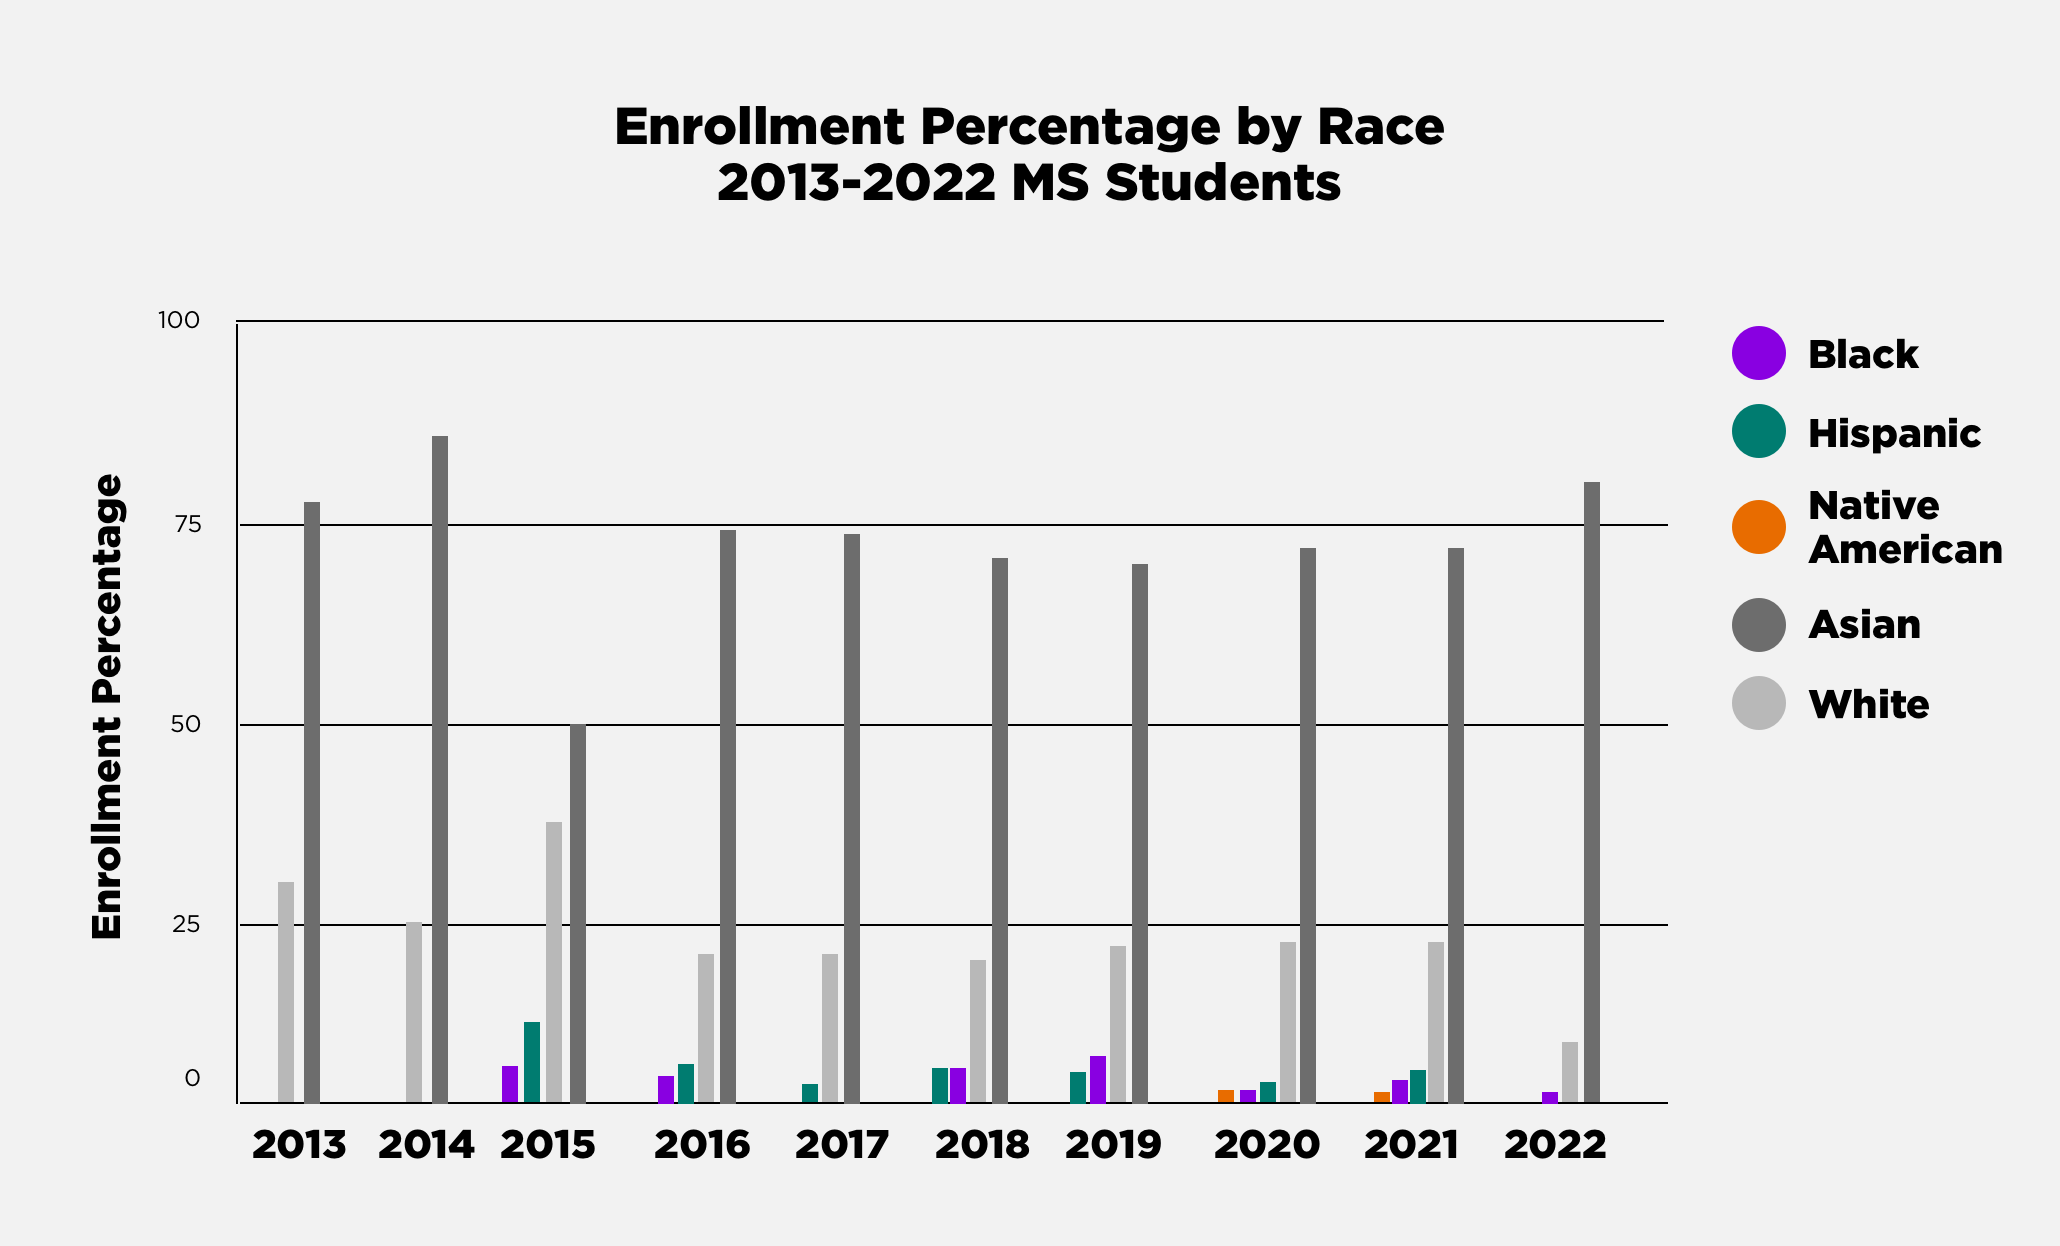
View MS Enrollment Numbers by Race ↓
Fall 2013
Asian: 68.97% | White: 24.14%
Fall 2014
Asian: 82.05% | White: 15.38%
Fall 2015
Asian: 50.00% | White: 35.00% | Hispanic: 10.00% | Black: 1.67%
Fall 2016
Asian: 74.67% | White: 20.00% | Hispanic: 2.67% | Black: 1.33%
Fall 2017
Asian: 72.09% | White: 19.77% | Hispanic: 1.16%
Fall 2018
Asian: 68.31% | White: 19.01% | Hispanic: 4.93% | Black: 4.93%
Fall 2019
Asian: 67.32% | White: 22.22% | Hispanic: 2.61% | Black: 3.27%
Fall 2020
Asian: 71.32% | White: 19.85% | Hispanic: 1.47% | Black: 0.74% | American Indian: 0.74%
Fall 2021
Asian: 66.90% | White: 17.93% | Hispanic: 4.83% | Black: 2.76% | American Indian: 0.69%
Fall 2022
Asian: 84.08% | White: 8.28% | Black: 0.64%
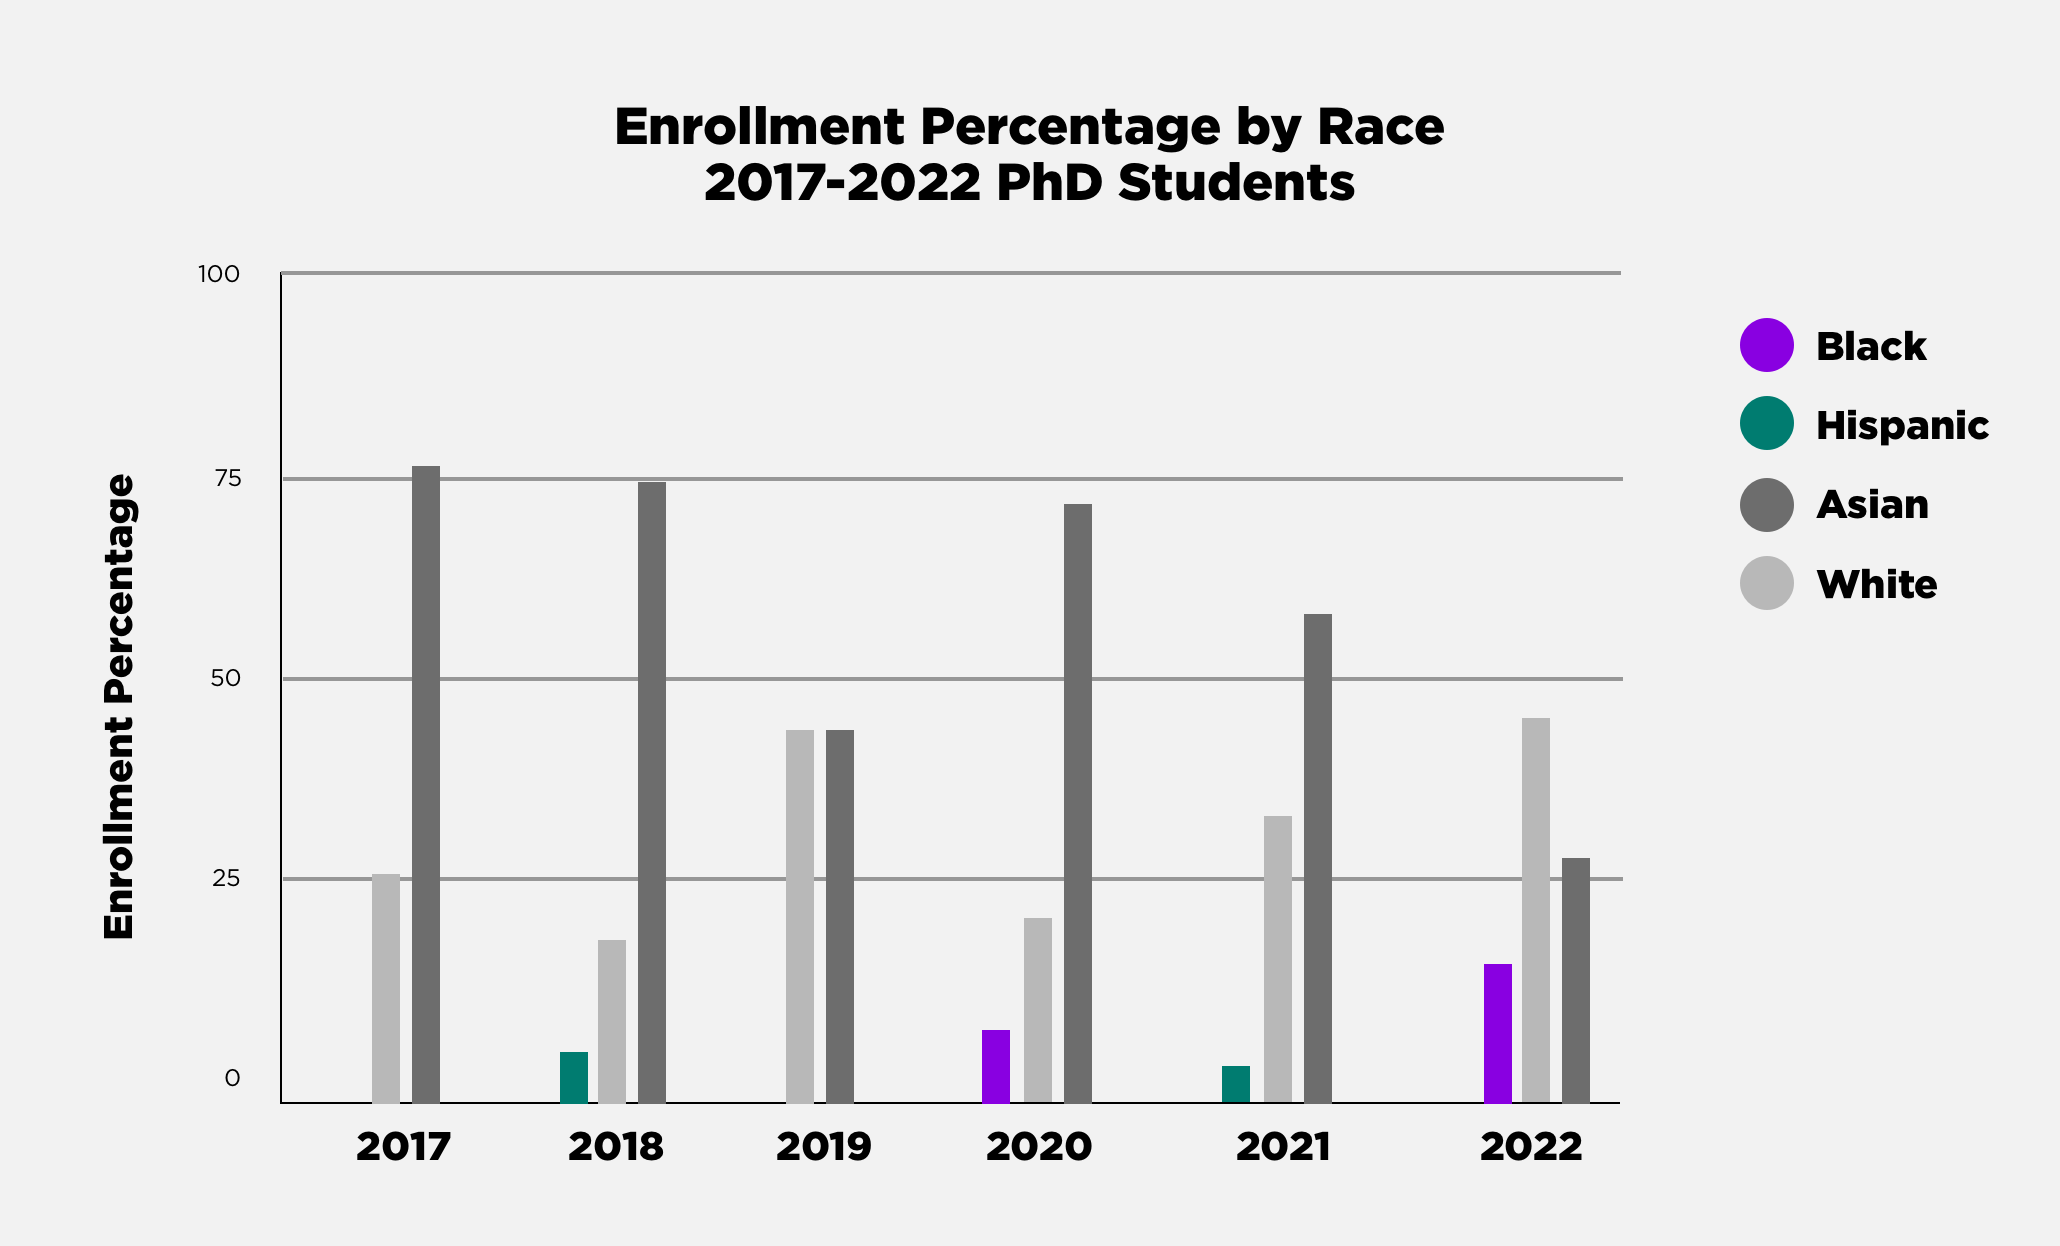
View PhD Enrollment Numbers by Race ↓
Fall 2017
Asian: 75.00% | White: 25.00%
Fall 2018
Asian: 71.43% | White: 14.29% | Hispanic: 7.14%
Fall 2019
Asian: 46.15% | White: 46.15%
Fall 2020
Asian: 69.23% | White: 15.38% | Black: 7.69%
Fall 2021
Asian: 58.33% | White: 33.33% | Hispanic: 8.33%
Fall 2022
Asian: 28.57% | White: 42.86% | Black: 14.29%
Gender
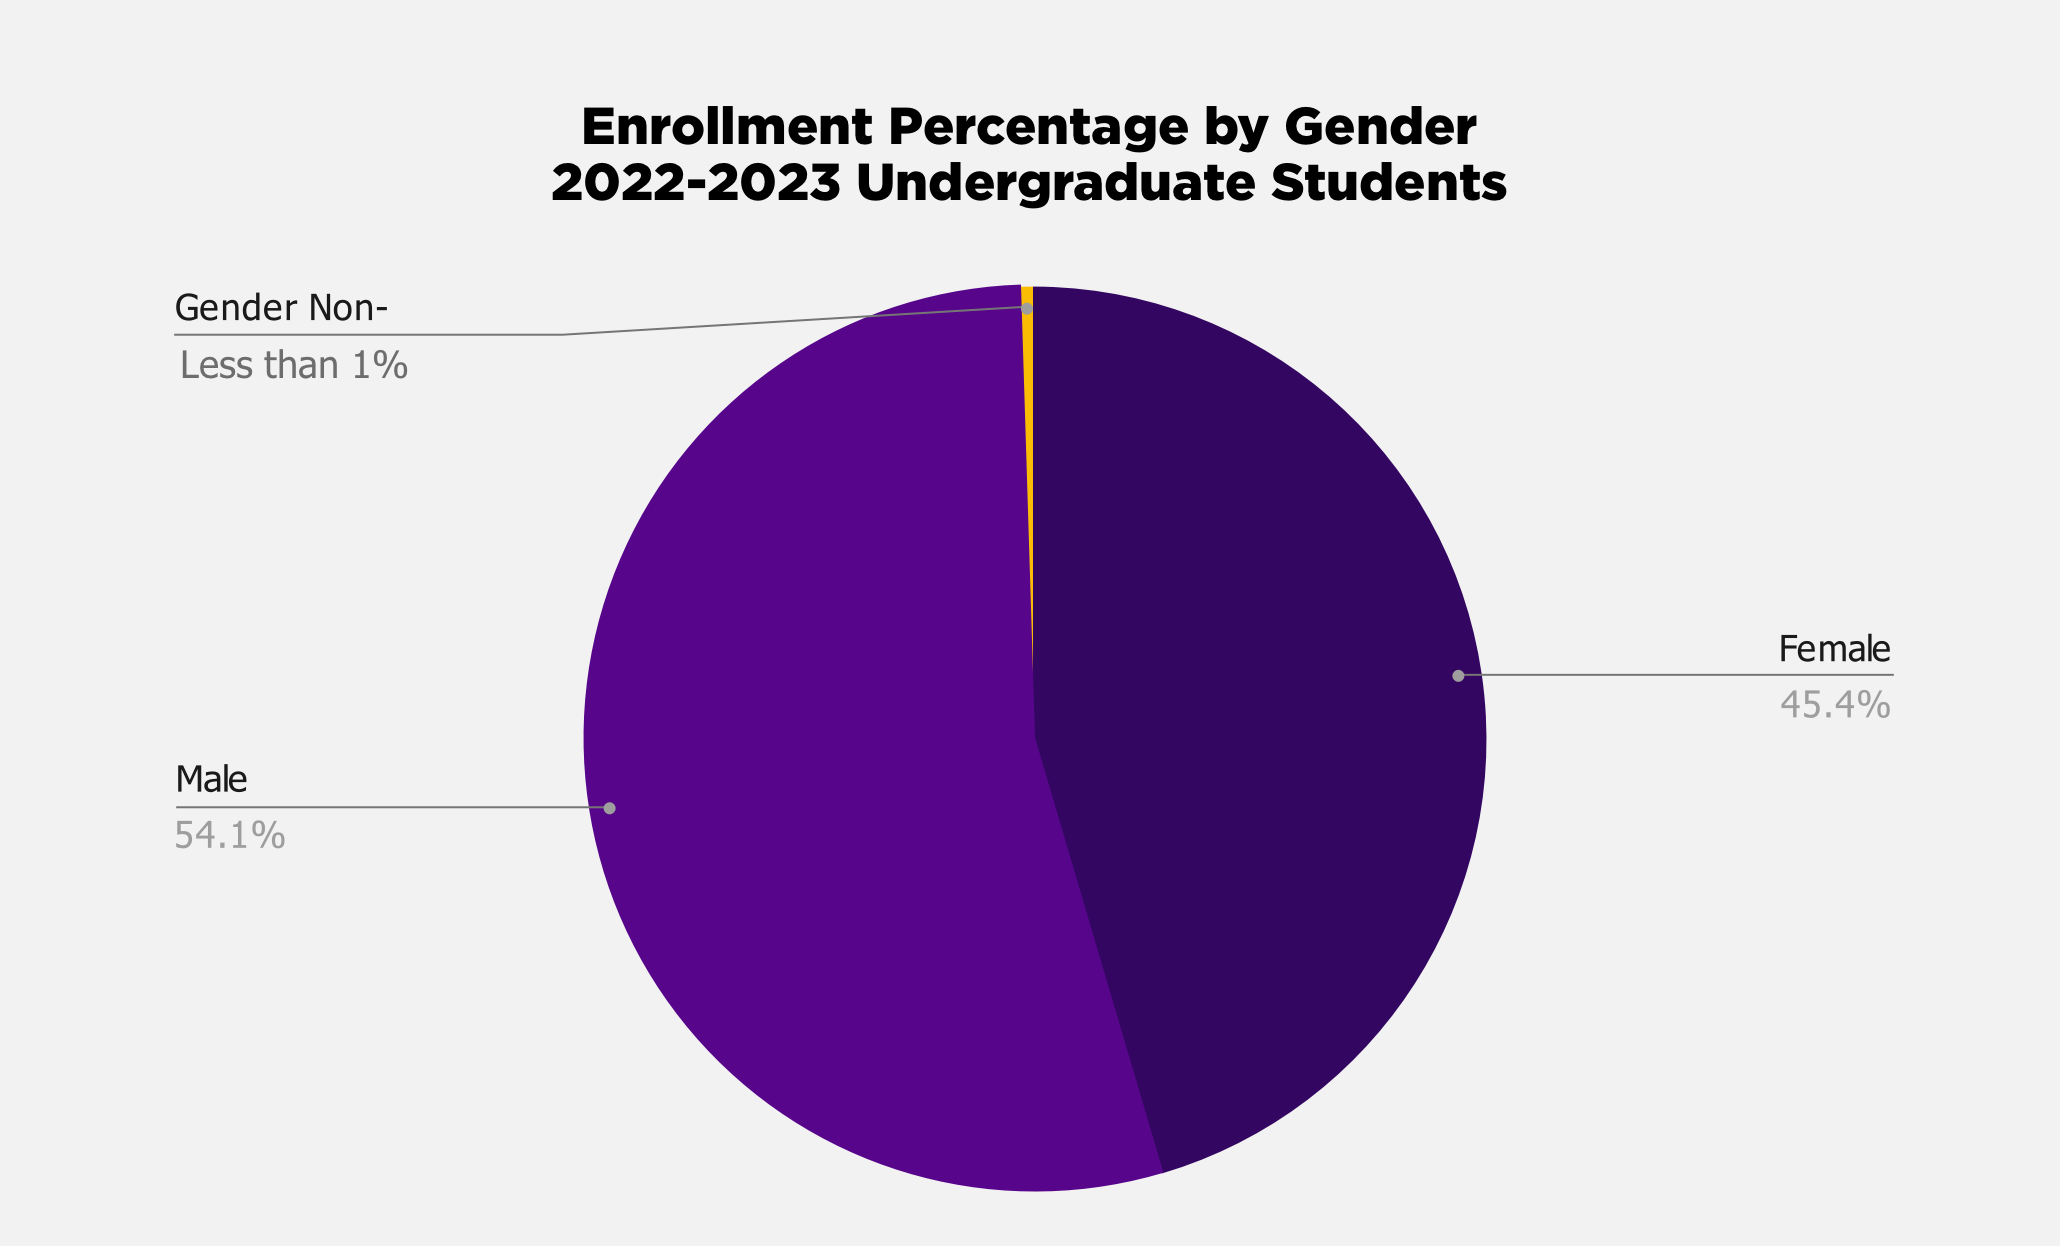
View Undergraduate Enrollment Numbers by Gender ↓
*2022-2023
- Female: 45.57%
- Male: 54.28%
- Gender Non-Confirming: Less than 1%
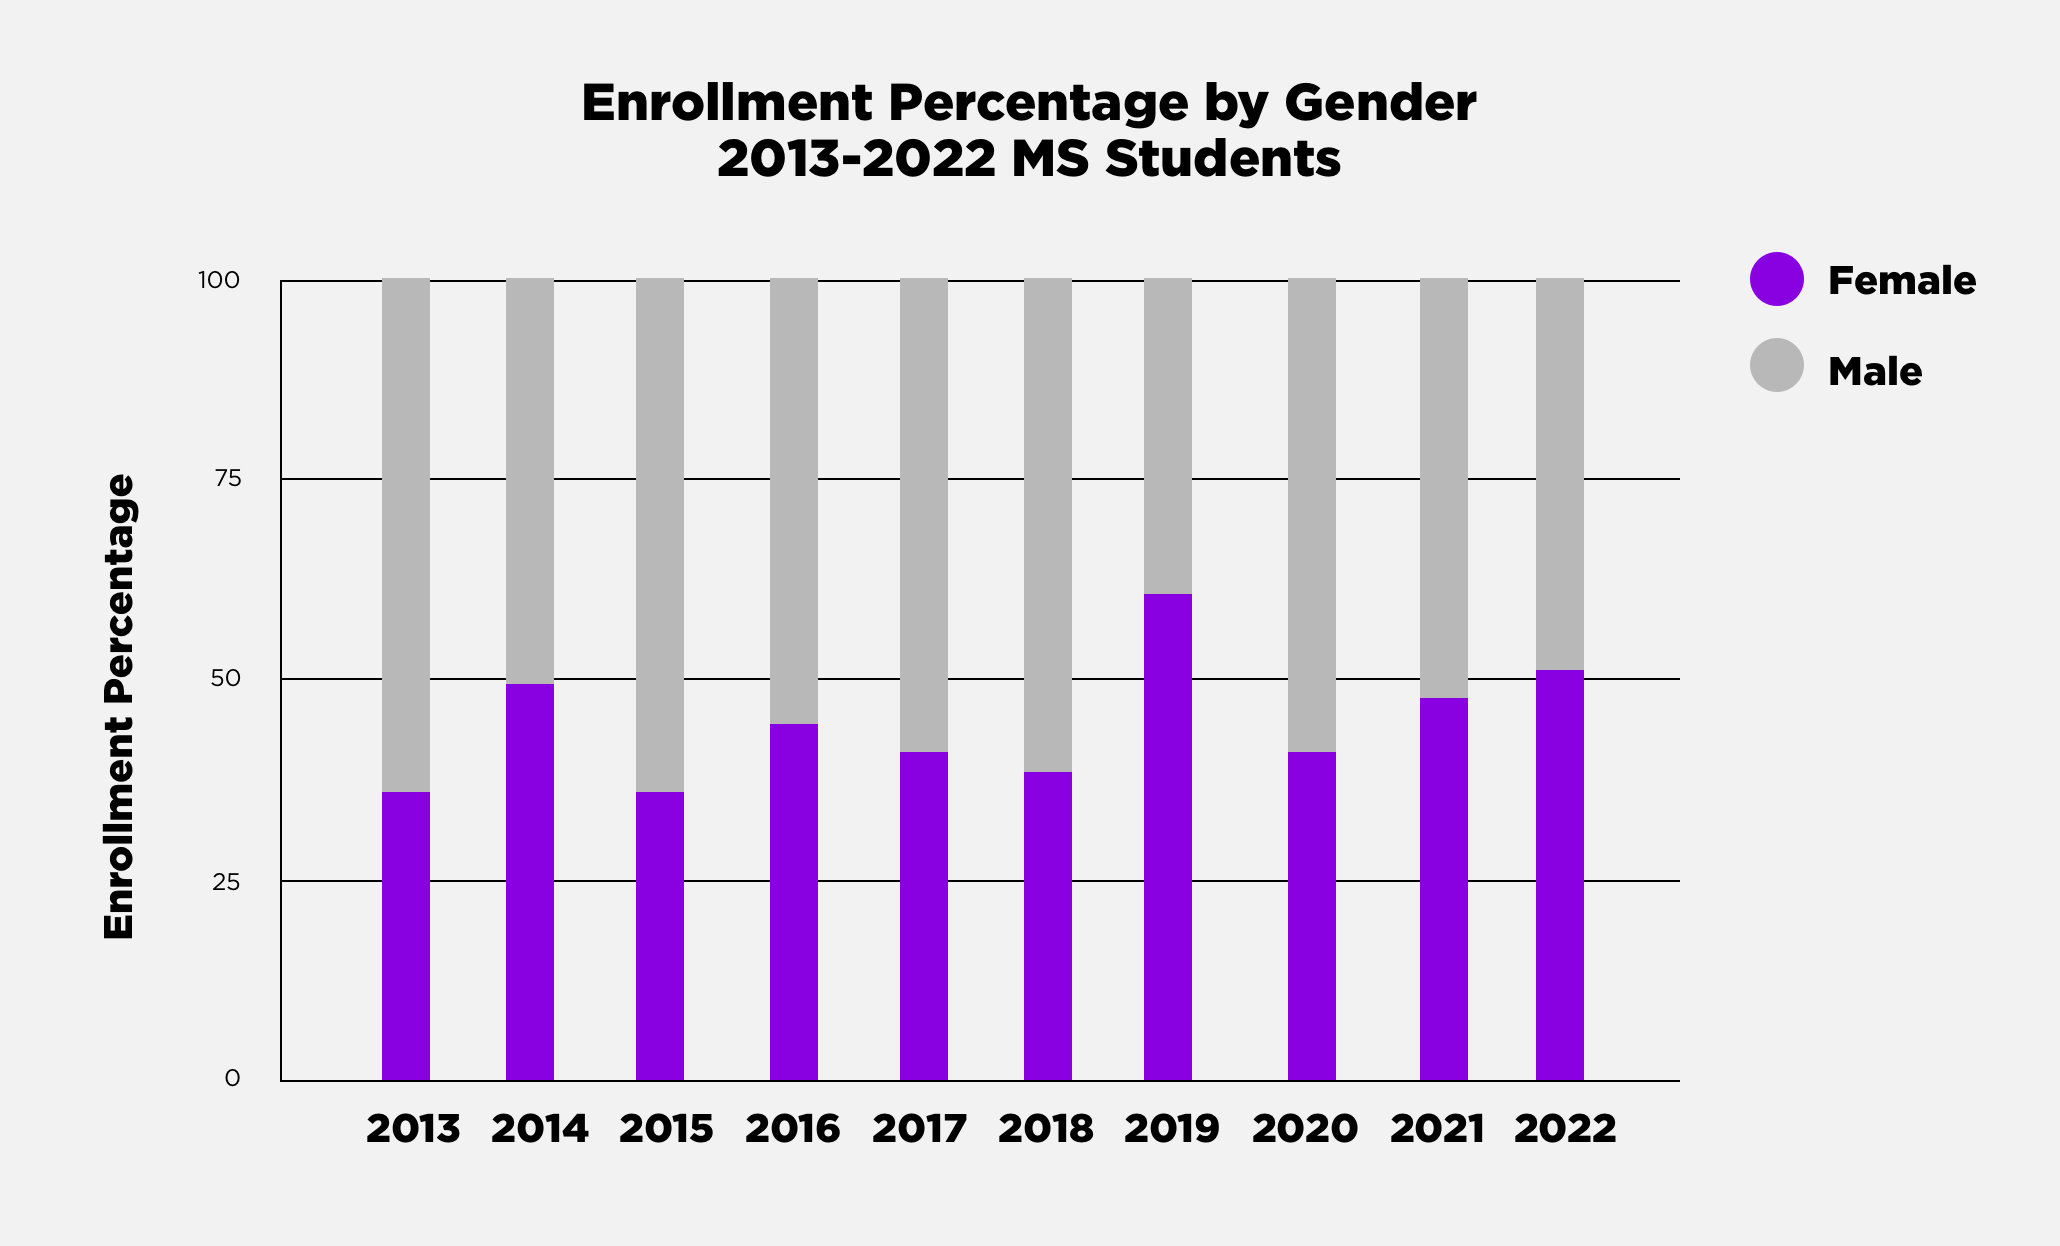
View MS Enrollment Numbers by Gender ↓
Fall 2013
Female: 31.03% | Male: 68.97%
Fall 2014
Female: 48.72% | Male: 51.28%
Fall 2015
Female: 38.33% | Male: 61.67%
Fall 2016
Female: 45.33% | Male: 54.67%
Fall 2017
Female: 41.86% | Male: 58.14%
Fall 2018
Female: 41.55% | Male: 58.45%
Fall 2019
Female: 52.94% | Male: 46.41%
Fall 2020
Female: 40.44% | Male: 59.56%
Fall 2021
Female: 47.59% | Male: 52.41%
Fall 2022
Female: 52.23% | Male: 47.77%
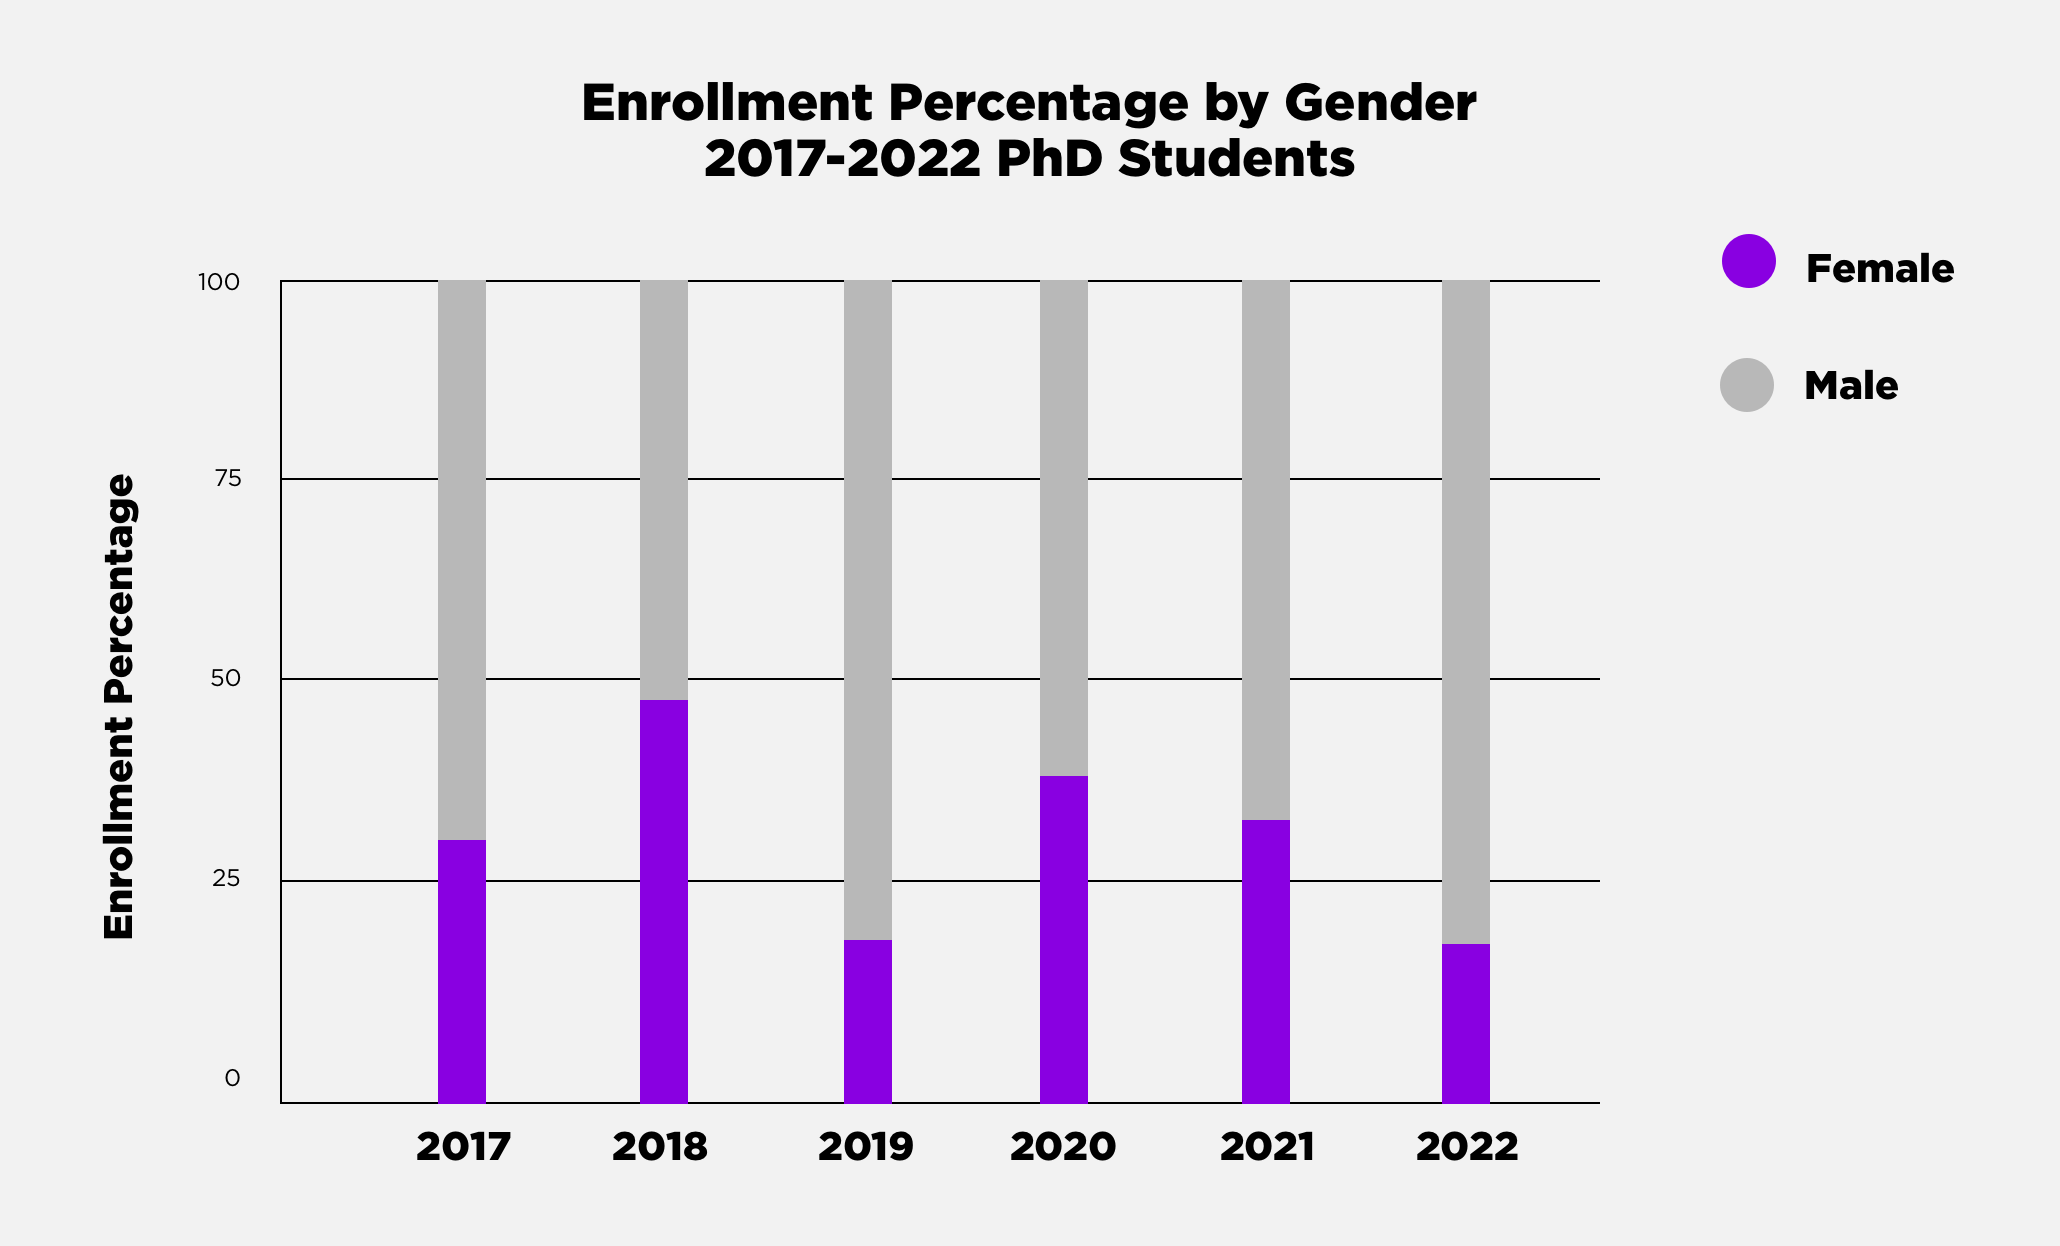
View PhD Enrollment Numbers by Gender ↓
Fall 2017
Female: 25.00% | Male: 75.00%
Fall 2018
Female: 50.00% | Male: 50.00%
Fall 2019
Female: 15.38% | Male: 84.62%
Fall 2020
Female: 38.46% | Male: 61.54%
Fall 2021
Female: 33.33% | Male: 66.67%
Fall 2022
Female: 14.29% | Male: 85.71%
Country of Origin
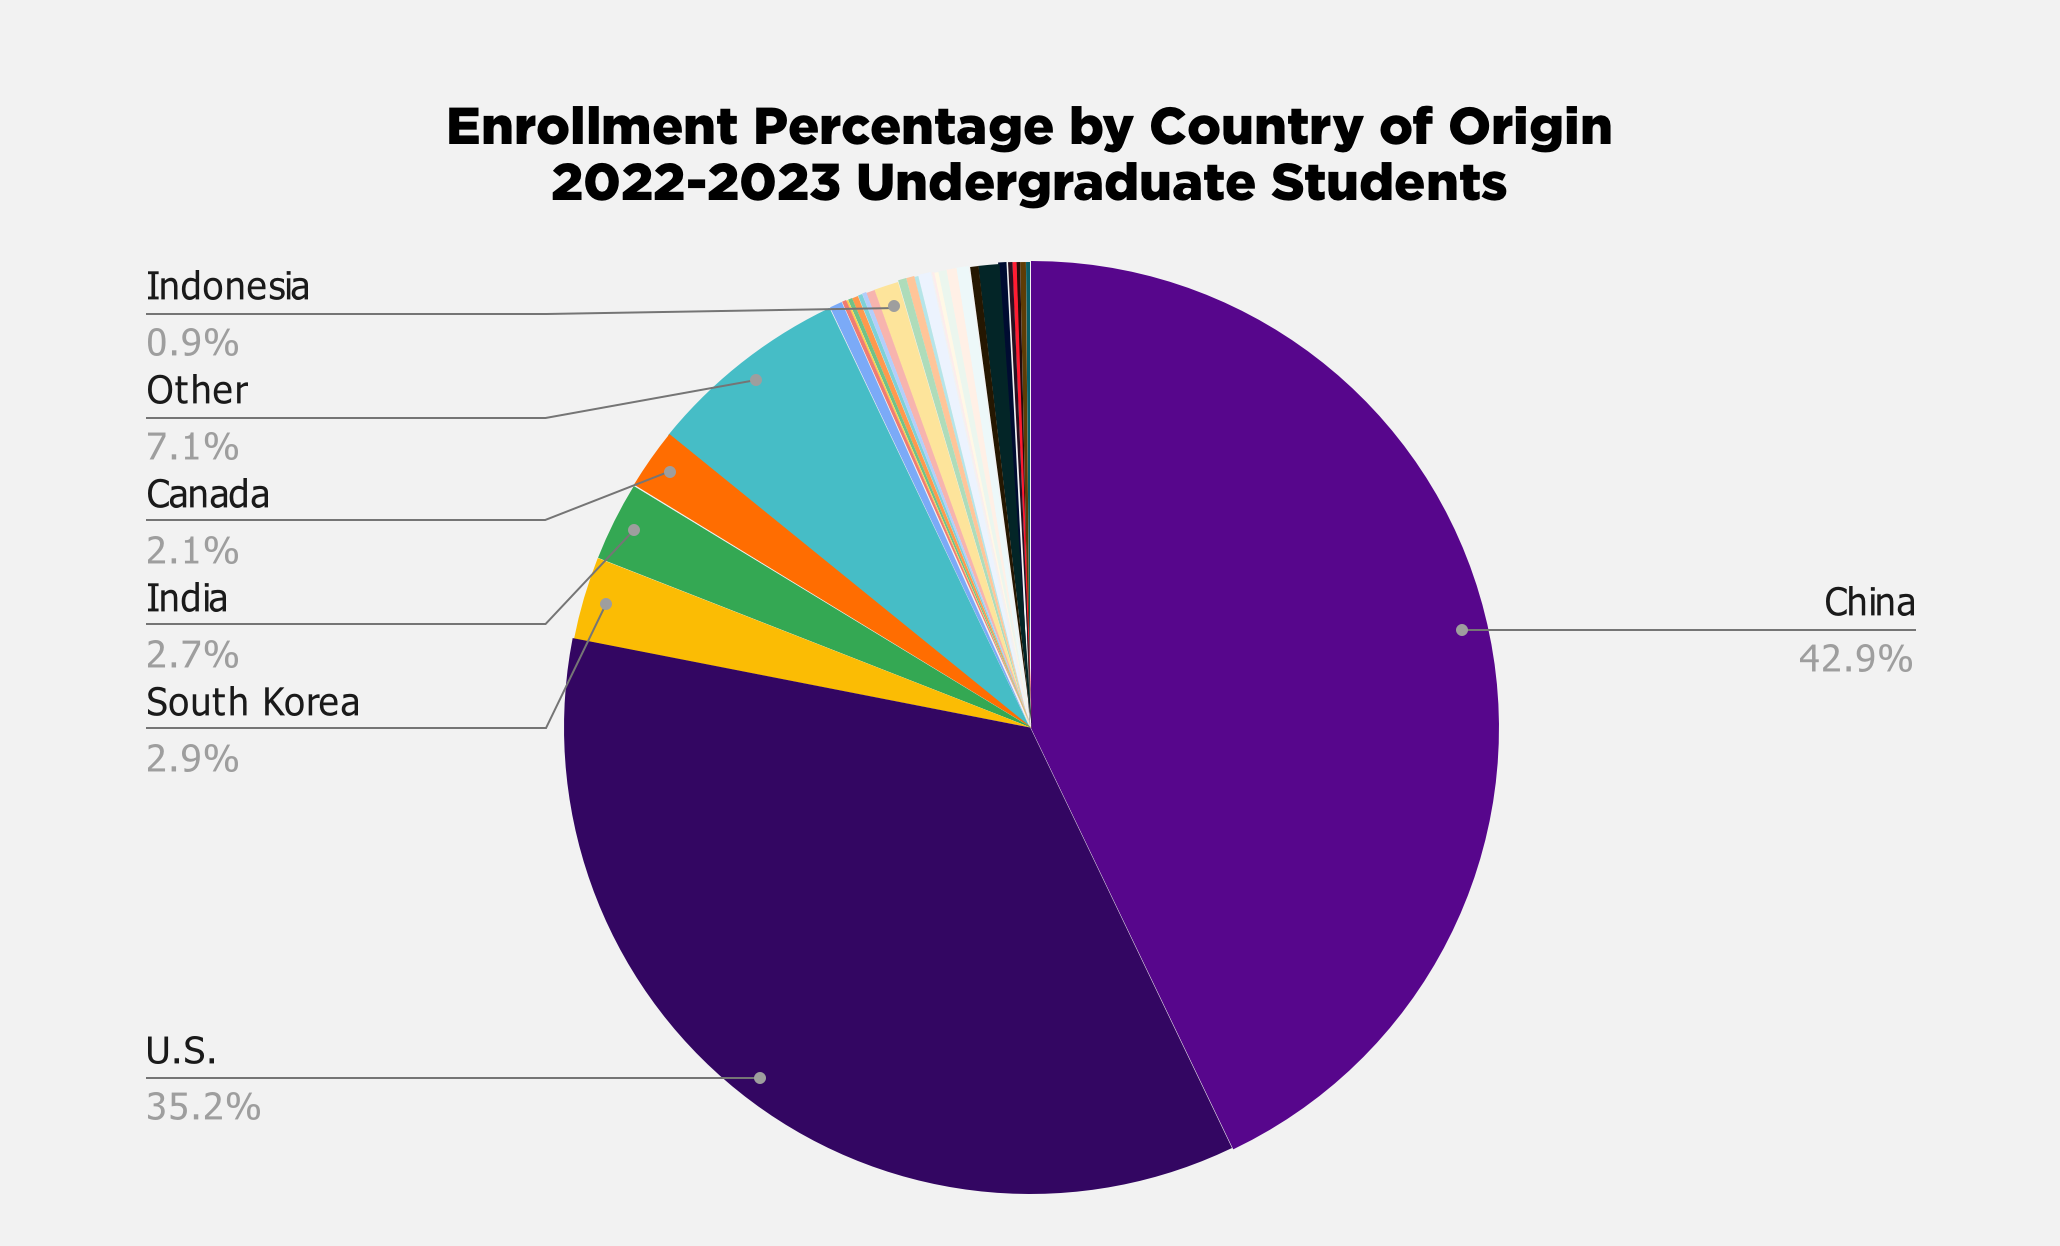
View Undergraduate Enrollment Numbers by Country of Origin ↓
*2022-2023
- China: 46.03%
- U.S.: 37.79%
- South Korea: 3.11%
- India: 2.95%
- Canada: 2.26%
- Other: 7.61%
- Brazil: 0.47%
- Colombia: 0.16%
- Costa Rica: 0.08%
- Croatia: 0.16%
- France: 0.23%
- Germany: 0.16%
- Greece: 0.16%
- Hong Kong: 0.33%
- Indonesia: 0.93%
- Jordan: 0.31%
- Malaysia: 0.31%
- Nigeria: 0.16%
- Pakistan: 0.47%
- Panama: 0.08%
- Republic of Serbia: 0.16%
- Russian Federation: 0.31%
- Saudi Arabia: 0.39%
- Singapore: 0.47%
- Spain: 0.31%
- Taiwan: 0.78%
- Thailand: 0.31%
- Turkey: 0.16%
- Ukraine: 0.16%
- United Arab Emirates: 0.16%
- United Kingdom: 0.23%
- Vietnam: 0.16%
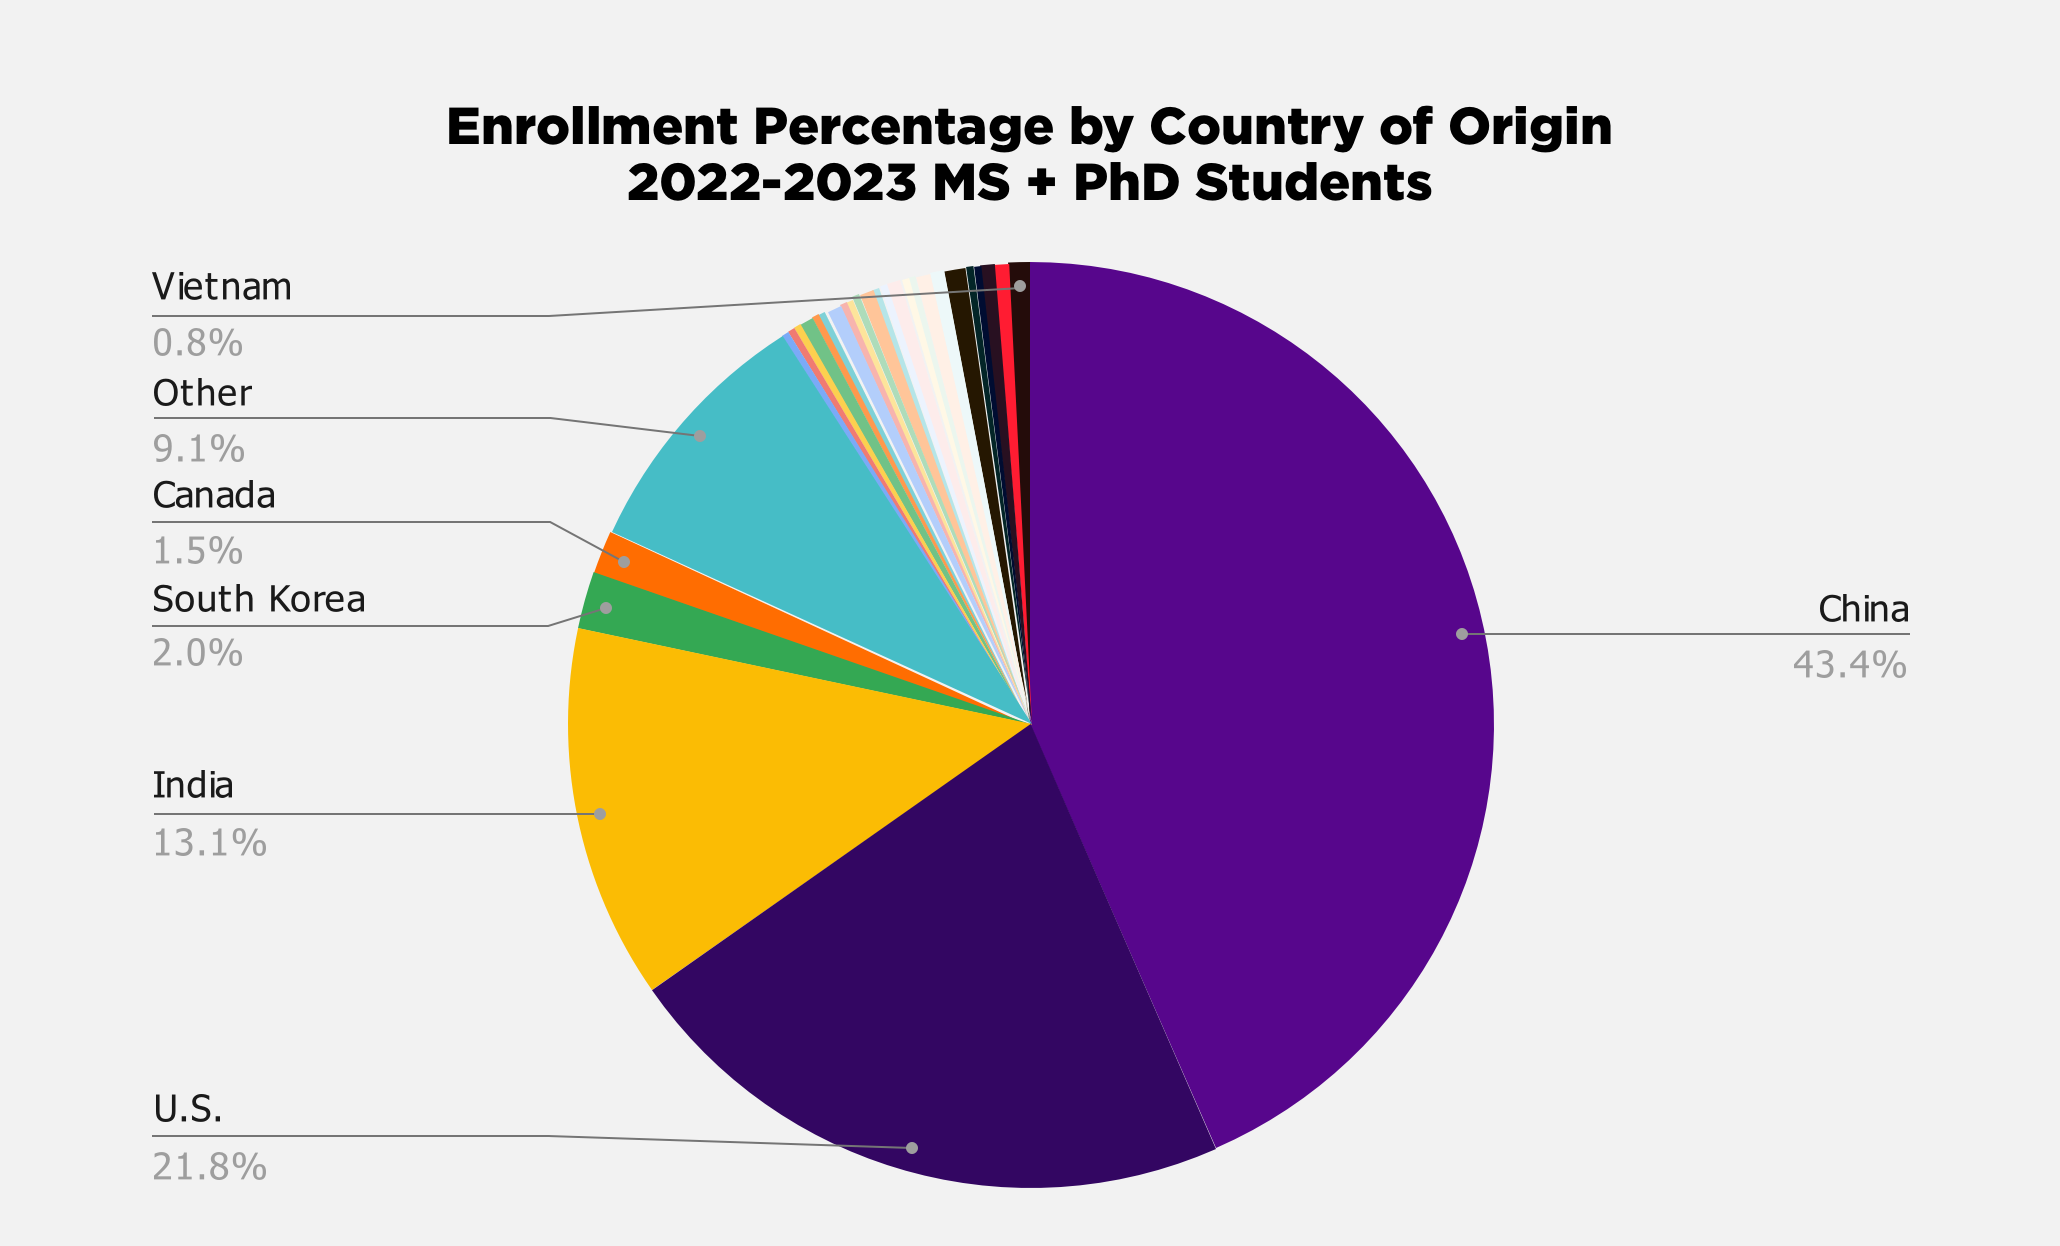
View MS & PhD Enrollment Numbers by Country of Origin ↓
*2022-2023
- China: 47.79%
- U.S.: 24.03%
- India: 14.36%
- South Korea: 2.21%
- Canada: 1.66%
- Other: 10%
- Argentina: 0.28%
- Bulgaria: 0.28%
- Belarus: 0.28%
- Brazil: 0.55%
- Chile: 0.28%
- France: 0.28%
- Greece: 0.55%
- Hong Kong: 0.28%
- Iran: 0.28%
- Israel: 0.28%
- Italy: 0.55%
- Japan: 0.28%
- Morocco: 0.28%
- Mexico: 0.55%
- Nepal: 0.28%
- New Zealand: 0.28%
- Russia: 0.55%
- Singapore: 0.55%
- Spain: 0.83%
- Thailand: 0.28%
- Turkey: 0.28%
- Taiwan: 0.55%
- United Kingdom: 0.55%
- Vietnam: 0.83%
First Generation

View Undergraduate Enrollment Numbers by First Generation ↓
*2022-2023
- First Generation Students: 15.70%
- Non-First Generation Students: 84.70%
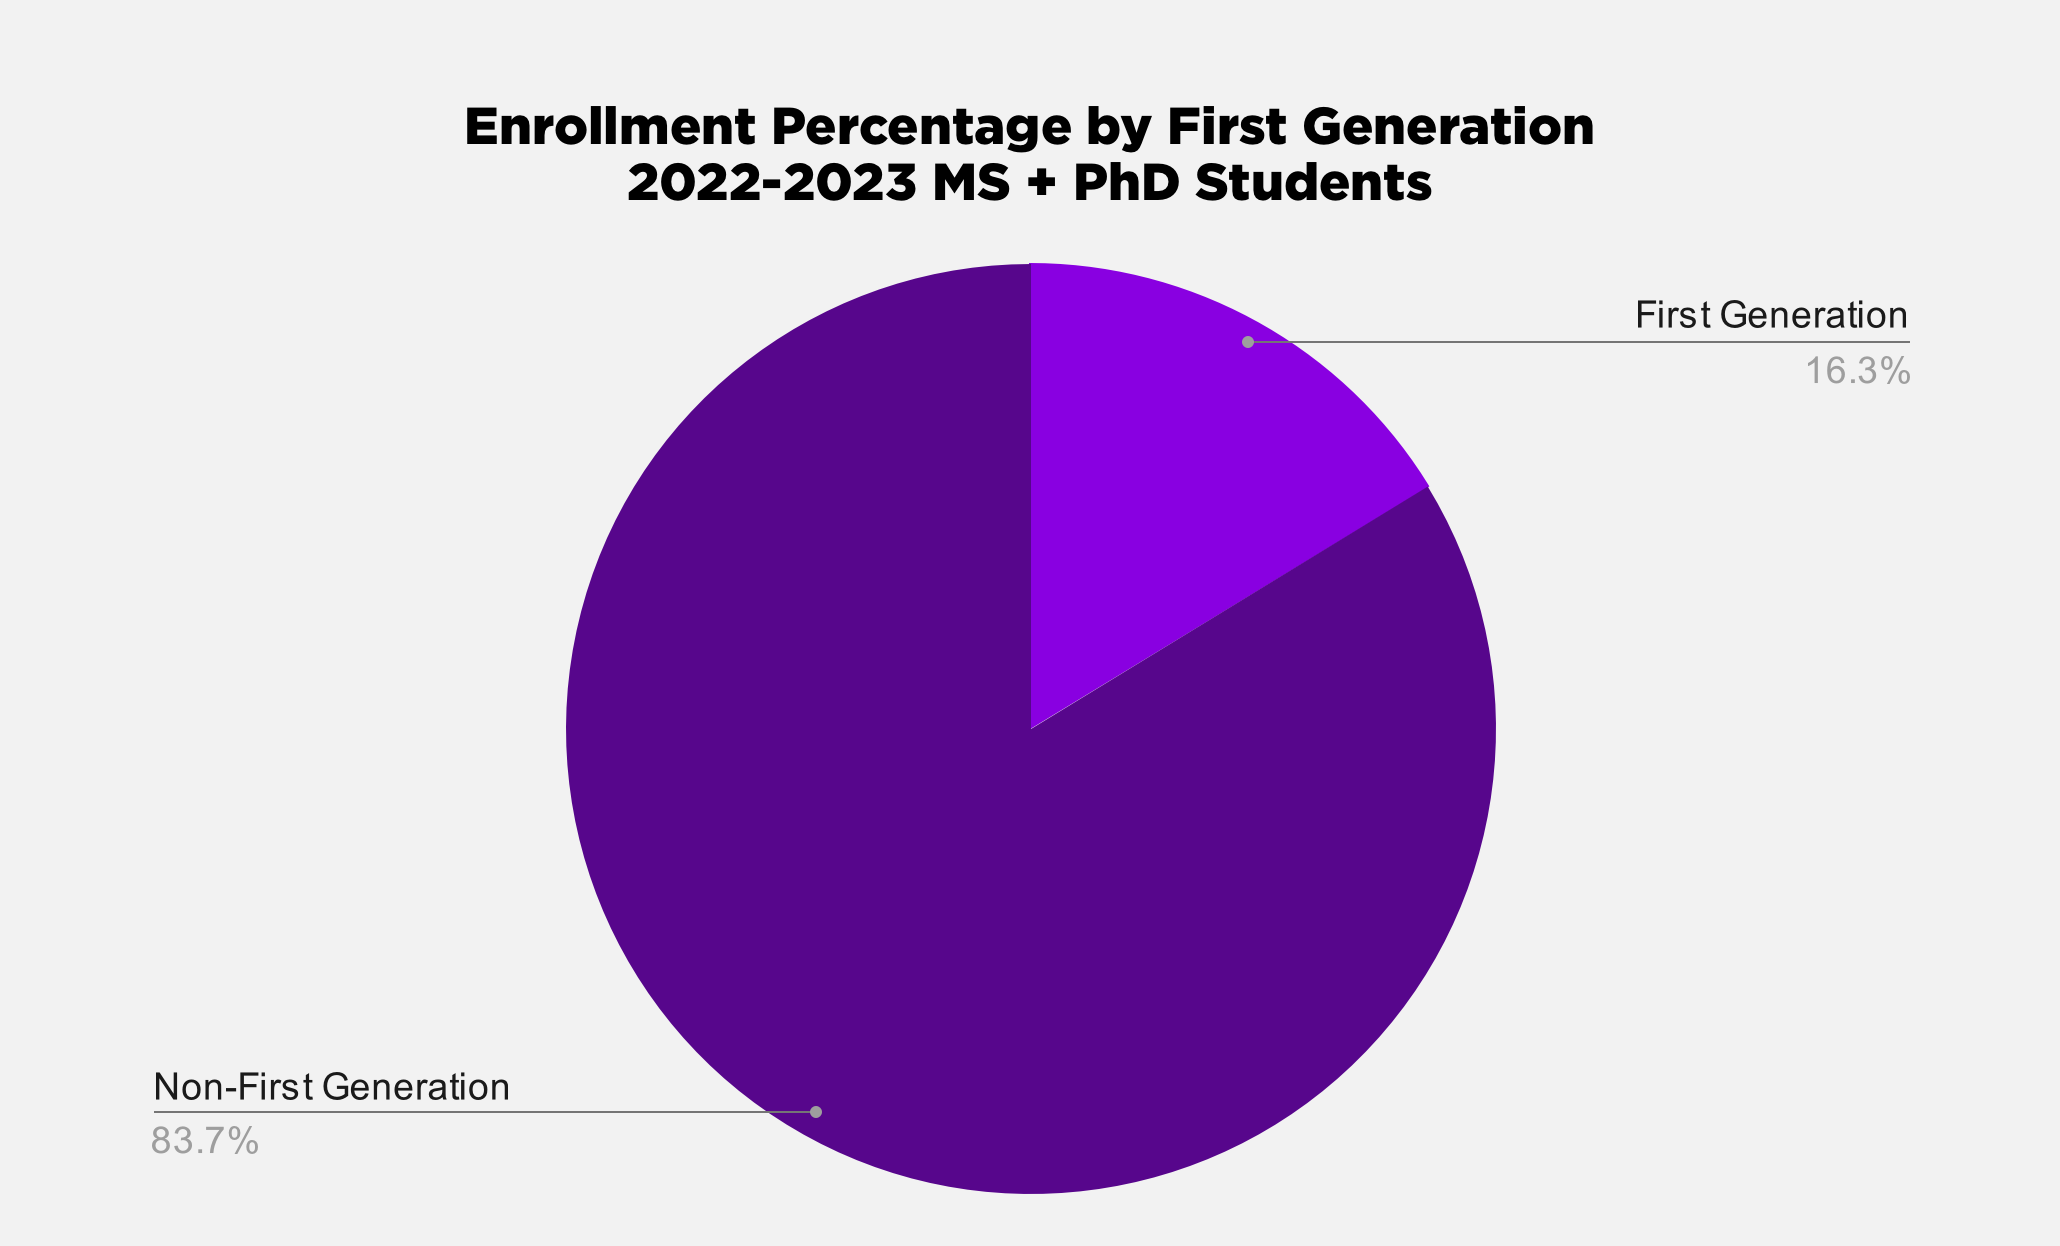
View MS & PhD Enrollment Numbers by First Generation ↓
*2022-2023
First Generation Students: 16.27%
Non-First Generation Students: 83.73%